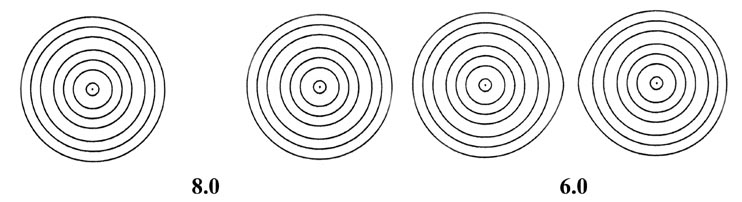
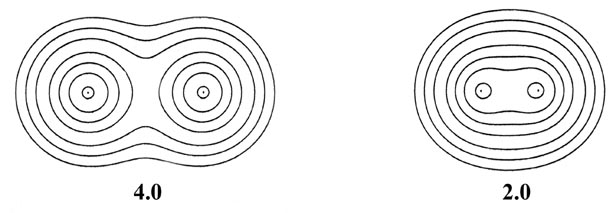
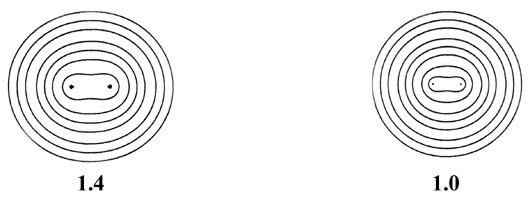
Fig. 6-9. A series of electron density contour maps illustrating the changes in the electron charge distribution during the approach of two H atoms to form H2. The internuclear distance R in units of au is indicated beneath each map. At R = 8 the atomic densities appear to be undistorted. At R = 6 the densities are distorted but still essentially separate. As R is further decreased, charge density contours of increasing value envelope both nuclei, and charge density is accumulated at the positions of the nuclei and in the internuclear region. The values of the contours in au increase from the outermost to the innermost one in the order 2 x 10-n, 4 x 10-n, 8 x 10-n, for decreasing values of n beginning with n = 3. Thus the outermost contour in each case is 0.002 au and the value of the innermost contour for R = 1.0 au, for example, is 0.4.