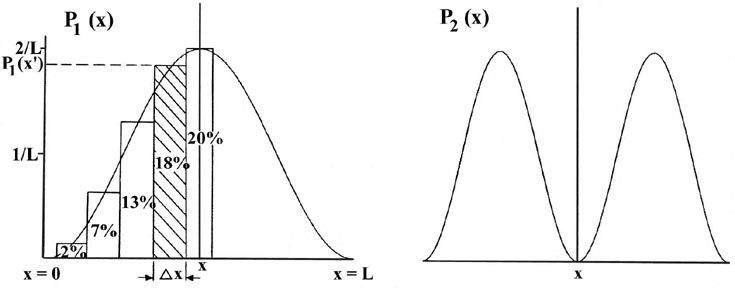
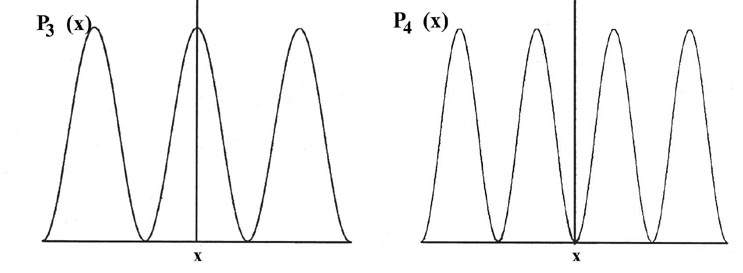
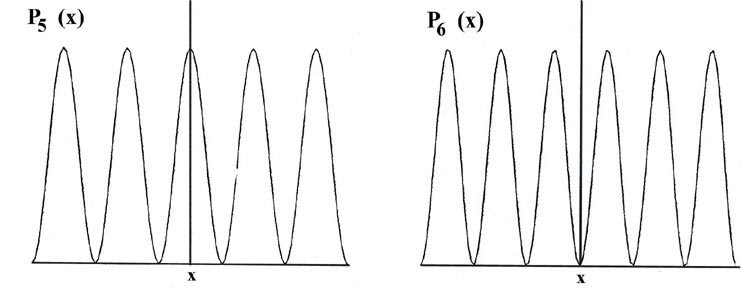
Fig. 2-4. Probability distributions Pn(x) for an electron confined to move on a line of fixed length in the quantum levels with n = 1, 2, ..., 6. The area of each rectangle shown in thefigure for P1(x) equals the probability that the electron is in the particular segment of the line Dx forming the base of the rectangle. The percentage shown in each rectangle is the percentage probability that the electron is in a particular segment Dx. The total probability that the electron is somewhere on the line is given by the total area under the P1(x) curve, that is, by the sum of each small element of area P1(x)Dx for each segment Dx. This total area is made to equal unity for every Pn(x) curve by expressing the values of Pn(x) in units of (1/L). Thus by definition a prbability of one denotes a certainty.