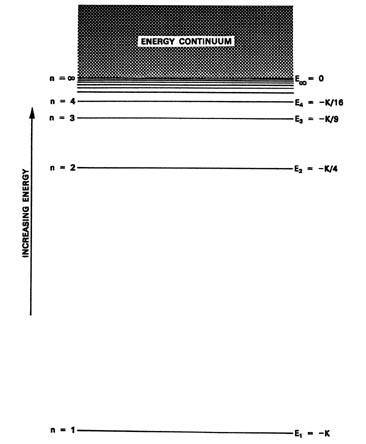
Fig. 3-2.
The energy level diagram for the H atom. Each line dentoes an allowed energy for the atom.